Almost everyone working in the field of machine learning is usually pretty sure about what a learning curve is. It seems to be intuitive. The problem is that each field has its own typical definition of a learning curve and it is unusual to write it down explicitely. The only general definition that I found is in the first sentence of a section of a Wikipedia article. The rest of the paragraph does not even apply to everything any more. The essence is:
A learning curve is a plot relating performance to experience.
Machine Learning in General
For machine learning in general, the definition is quite clear: "A learning curve shows the validation and training score of an estimator for varying numbers of training samples." (scikit-learn documentation) Actually these are two learning curves. One that shows how well the optimization for the training data worked and one that tries to estimate the generalization error for varying number of training samples. The validation score is usually estimated with cross-validation. That is the reason why we can also plot the standard deviation interval for these curves. A score can be any performance metric that is applicable to the method and domain. An overview of the possible metrics can be found here. It includes metrics for classification (e.g. accuracy), clustering, and regression (e.g. mean squared error).
Here are some examples:
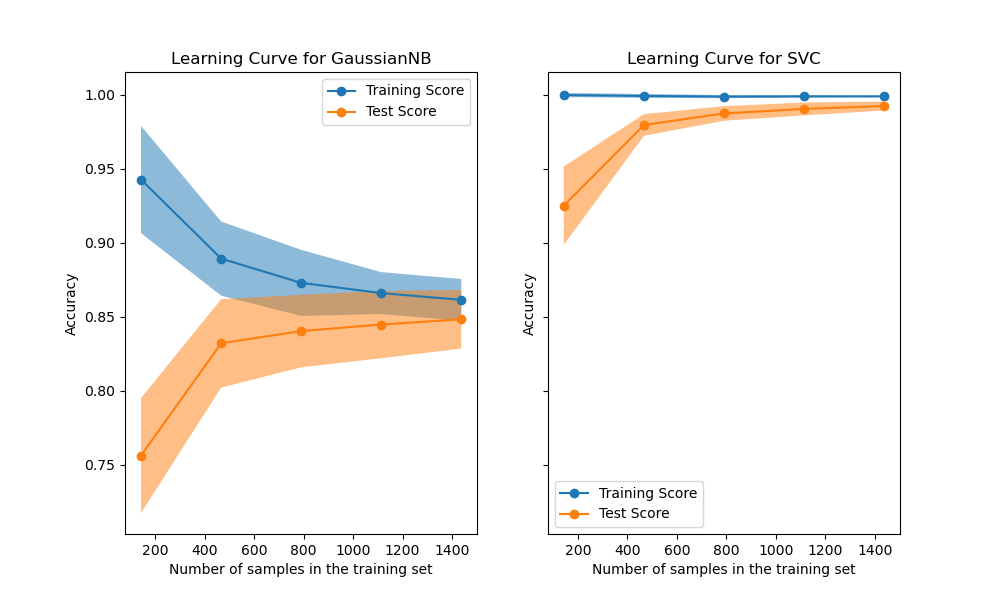
scikit-learn documentation, source.
In both cases the accuracy of classification algorithms is displayed. In the first example, you can clearly see that the algorithm poorly fits the training data. The model is not comlex enough. In the second example, the model fits the training data perfectly and even generalizes very well.
Neural Networks
In the neural networks (or deep learning) community, people usually have a different idea of a learning curve. Experience is typically not measured in samples. Experience is measured in optimization steps, that is, a neural network that has "seen" the same sample twice has more experience than a neural network that only saw it once. How we measure experience exactly is not so clear, however. There are numerous options:
- epochs - There is no clear definition of an epoch, either. One epoch usually means that the neural network has seen the whole training set exactly once. A more clear way to say this is "iterations over the entire dataset". Sometimes an epoch means the neural network has seen as many samples as there are in the training set but there might be some duplicates and it might not have seen some of them. This is because mostly optimization methods based on stochastic gradient descent are used and they do not keep track of which samples they already selected in the current epoch.
- updates - This definition is quite clear: we count each weight update. This is the same as counting each mini-batch that is passed forward and backwards in the neural network as nowadays people usually use mini-batches to be able to parallelize the execution on a GPU. However, it makes comparisons a little bit hard sometimes because the actual experience of the neural network depends on the size of the mini-batch. Sometimes you will also read the term iterations instead of updates.
- samples - This seems to be similar to the definition of a learning curve for machine learning in general. It is not. As I mentioned before, presenting the same sample twice increases the experience of a neural network, hence, each time a sample is used to update the weights of a neural network, this counter will be increased.
- even wall-clock time - Comparing wall-clock time is usually not a good idea because it is not comparable with other machines. Even on the same system, a scheduler could distort the results. Admittedly, sometimes it is the best way to show that your method trains faster and can collect more experience in a given period of time. Although wall-clock time is approximately proportional to experience for the same model, it is not a good way to compare performance in relation to experience of different models.
Performance metrics are quite similar to those used for classification, regression, or to whatever is used in the domain in which the neural network is used. Often a learning curve just shows the loss, cost, or error that is optimized.
Because of the incremental and often expensive training of neural networks, cross validation is not an option for these learning curves. The standard procedure is to use a holdout validation set on which we can evaluate the neural network each time we want to compute a data point for the learning curve.
Here are some examples:
- Kingma, Ba - Adam: A Method for Stochastic Optimization (2017), arxiv. Figure 2 (a): Relates "training cost" to "iterations over entire dataset" to compare optimization algorithms for neural networks (AdaGrad, RMSProp, SGDNesterov, AdaDelta, Adam).
- Krizhevsky, Sutskever, Hinton - ImageNet Classification with Deep Convolutional Neural Networks (2012), NIPS. Figure 1: Relates "training error rate" to epochs to compare ReLU with tanh as activation function for neural networks.
- He, Zhang, Ren, Sun - Deep Residual Learning for Image Recognition (2015), arxiv. Figure 4 (right): Relates "error (%)" to iterations to compare ResNets of different depths.
- Schaul, Zhang, LeCun - No More Pesky Learning Rates (2013), arxiv. Figure 4: Relates loss to number of samples to compare different optimization algorithms and parameters.
- Erhan, Courville, Bengio, Vincent - Why Does Unsupervised Pre-training Help Deep Learning? (2010), PMLR. Figure 7: Relates "online classification error" to number of examples seen to test how unsupervised pretraining affects supervised training.
- Chung, Gulcehre, Cho, Bengio - Empirical Evaluation of Gated Recurrent Neural Networks (2014), arxiv. Figure 2 (left bottom): Relates negative log-likelihood to wall-clock time to compare several types of recurrent units.
Reinforcement Learning
There is even more chaos in reinforcement learning (RL). It is not just unclear how to measure experience, there are even more ways to measure performance. It is often very specific to the domain in which we apply RL.
Let's start with experience. We have a classification that is very similar to the one for neural networks:
- updates, iterations
- episodes, trials, rollouts
- time steps
One thing to note is that there are multiple categories of algorithms: some methods learn after each step, some update after each episode and some only update after multiple episodes. That makes it sometimes quite hard to compare methods.
Measuring performance in RL is difficult because there are so many different approaches. In some publications you will find accumulated returns over all episodes, similar to the regret in multi-armed bandit problems. Sometimes only the return over episodes is shown. Sometimes an average return over multiple test episodes is shown. Sometimes the average return over multiple test episodes with different conditions is shown. Sometimes the return is called reward (return is the accumulated reward of an episode, in some problems only one reward is given at the end of an episode). Sometimes a cost is computed instead of a return. Sometimes domain-specific performance metrics are used. The list goes on and on.
Here are some examples:
- Sutton - Integrated Architectures for Learning, Planning, and Reacting Based
on Approximating Dynamic Programming (1990),
PDF.
- Figure 3: Relates steps per trial (performance metric) to number of trials to show the effect of planning in the Dyna architecture.
- Figure 5 (bottom): Relates the cumulative reward to the number of time steps to compare several algorithms that implement the Dyna architecture.
- Mnih, Kavukcuoglu, Silver, Rusu, Veness, Bellemare, Graves, Riedmiller, Fidjeland, Ostrovski, Petersen, Beattle, Sadik, Antonoglou, King, Kumaran, Wierstra, Legg, Hassabis - Human-level control through deep reinforcement learning (2015), PDF. Figure 2a: Relates the average score per (test) episode to training epochs to show the learning progress. An epsilon-greedy policy has been used during evaluation. A training epoch seems to be an episode. Although both is not completely clear to me.
- Peters, Vijayakumar, Schaal - Natural Actor-Critic (2005),
Springer.
- Figure 2 (1) (b): Relates expected return to episodes to compare several algorithms. It is not clear to me how the "expected" return can be computed. It is probably just an average.
- Figure 2 (2): Relates expected cost to number of episodes. This paper is very inconsistent.
- Peters, Mülling, Altün - Relative Entropy Policy Search (2010), AAAI. Figure 1 (c): Relates expected return to policy updates to compare several algorithms.
- Kober, Peters - Policy Search for Motor Primitives in Robotics (2009), NIPS. Figure 5: Relates average return to number of rollouts to show the learning progress in a difficult application. The mean and standard deviation over 20 runs are shown.
- Daniel, Neumann, Peters - Hierarchical Relative Entropy Policy Search (2012), PMLR. Figure 5 (a): Relates average reward to iteration to compare several parameters. An iteration requires multiple episodes.
- Kupcsik, Deisenroth, Peters, Neumann - Data-Efficient Generalization of Robot Skills with Contextual Policy Search (2013), PDF. Figure 6: Relates reward to evaluations to compare several algorithms. Only one reward is given at the end of an episode which makes the reward also the return. An evaluation is an episode. The mean and standard deviation are computed over 20 runs.
- Fabisch, Metzen - Active Contextual Policy Search (2014), JMLR. Figure 8: Relates the "distance to test targets" to episodes. In this specific experiment, the goal is to throw a ball at a given target. The target is a parameter, hence the distance is an average over multiple test targets. The mean and standard deviation shown, however, are computed over 20 runs.